The question a beekeeper asks most frequently is actually simple: “When should I move my hives, when should I harvest, when should I give supplemental feed?” The answer depends not on the instantaneous weather, but on the actual developmental stage of the plants—and the calendar date does not reliably indicate this stage. Designed to work offline considering low internet access in rural areas, Polinasyon Lab’s nectar flow score is an experimental indicator aiming to bridge this gap using the GDD (Growing Degree Days) method. In this article, we explain the mathematical foundation of the score, the data it uses, and—just as importantly—its limitations.
Why is it difficult to predict nectar flow?
Nectar secretion occurs at the intersection of many variables such as temperature, humidity, soil water, plant developmental stage, and species-specific physiology. Simply saying “the weather is warm and sunny” is not enough—if the plant has not yet reached the flowering stage, even the most ideal weather conditions will not create a nectar flow. Therefore, a reliable prediction must combine instantaneous weather data with information on what developmental stage the plant is currently in. The GDD method builds precisely this bridge.
How is the GDD (Growing Degree Days) method calculated?
GDD is based on the observation that the rate of plant development is proportional to the accumulation of the daily mean temperature above a certain base temperature threshold. The basic formula can be summarized as follows:
GDD = [(Max Temperature + Min Temperature) / 2] − Base Temperature
For example, assuming a base temperature of 10°C for the target plant species, if a day’s maximum temperature is 22°C and its minimum temperature is 14°C, the daily mean is 18°C; this provides an accumulation of 8 degree-days for that day. This accumulation gathered from the beginning of the season helps predict when the plant will reach its peak nectar stage much more reliably than a fixed calendar date.
What data does the score use?
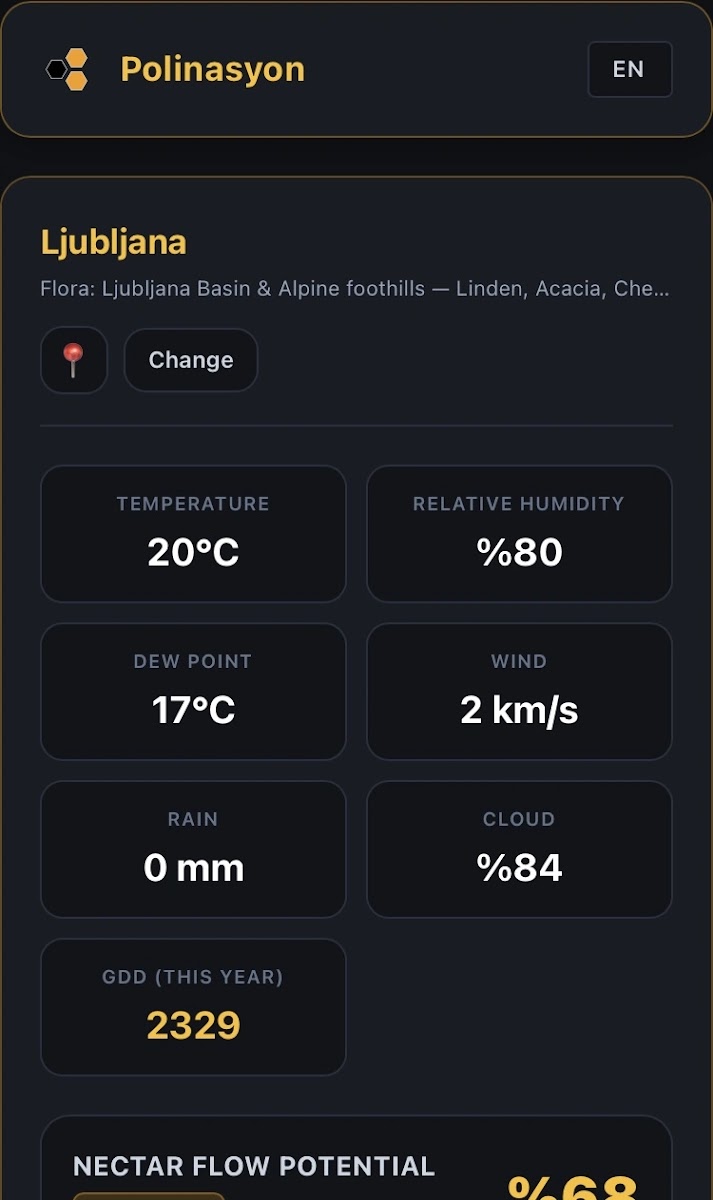
The nectar flow score is not based on a single value, but on a multi-layered composition weighted by region:
- Bee flight temperature (~10–30°C) — The optimum temperature range in which honey bees actively fly and forage for nectar.
- Wind speed — High wind directly restricts the flight efficiency and foraging duration of field bees.
- Relative humidity — Affects nectar concentration and the rate of nectar secretion evaporation in the plant.
- Dew point depression — Indicates the dryness/humidity balance in the air and plant water stress.
- 3-day temperature trend — Delayed effects of sudden temperature fluctuations on plant nectar flow and bee behavior.
- Precipitation & cloud cover — Factors that limit the number of flyable days and the photosynthesis cycle.
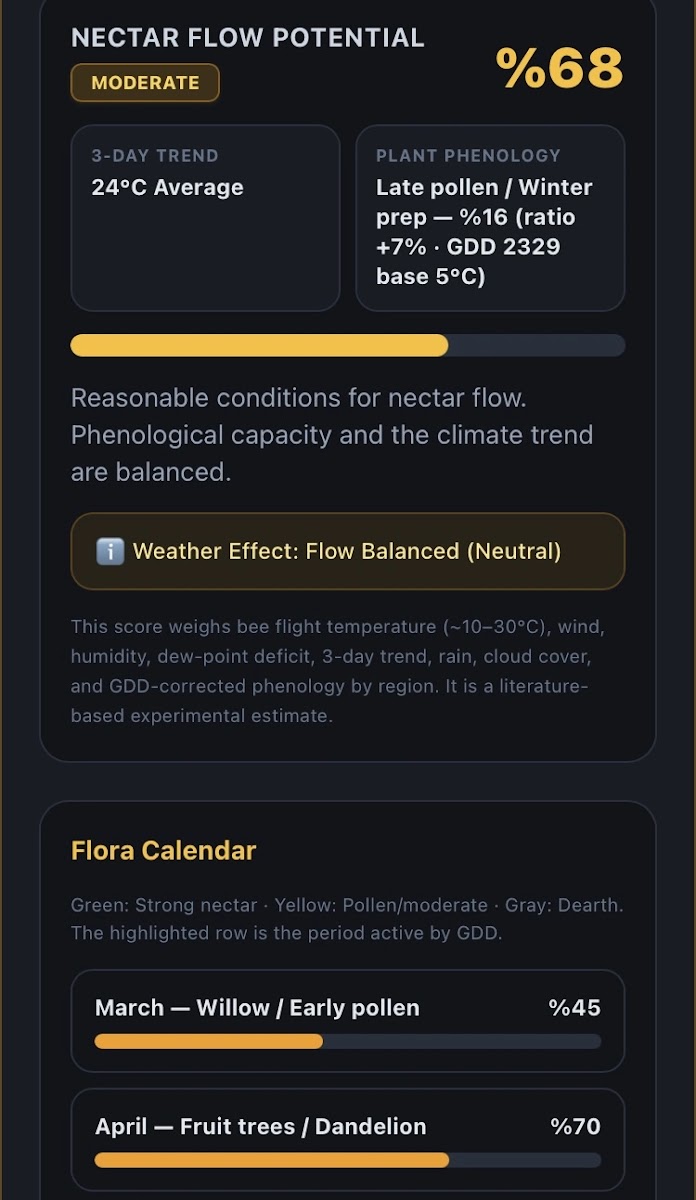
- GDD-adjusted phenology — Dynamic shifting of the regional flora calendar according to that year’s actual temperature accumulation.
- Regional weighting — Calibration of the same raw meteorological data according to different climate zones.
Why is regional weighting necessary?
The same 18°C and 70% humidity have very different meanings across Europe. In the Pannonian plain (for example around Ljubljana or in parts of Hungary and Romania) this can be a normal spring day. In the Alpine foothills of Austria or Slovenia it may still feel cool, while along the Black Sea coast of Bulgaria or Romania it can already represent a warm period. Therefore, temperature, wind, humidity, dew point depression, precipitation, cloud cover, and phenology coefficients are mapped separately according to climate zones typical for Central Europe, the Alps, the Pannonian basin, and the Black Sea region. The fact that the same raw weather data produces different scores in different regions is not an error, but a deliberate design decision based on ecosystem reality.
What do the score bands mean?
| Band | Colony and Field Interpretation |
|---|---|
| STRONG (≥70) | Ideal instantaneous weather conditions coinciding with active plant phenology; high flora-derived nectar secretion is expected. |
| MODERATE (40–69) | Reasonable field conditions present; phenological capacity and climate trend are balanced. |
| WEAK (<40) | Phenological mismatch, insufficient heat accumulation, or excessive climate stress (frost/drought risk) may occur. |
What are the limitations of this score?
TRANSPARENCY AND FIELD RESPONSIBILITY NOTE
The nectar flow score is an analytical prediction based on general weather service data, literature-based base temperature assumptions, and regional coefficients; it does not replace a directly calibrated, one-to-one measurement in the field. Microclimate differences (valley floor, wind corridor, irrigation status), colony strength, varroa/disease status, and physical observation by the beekeeper opening the hive cover always take precedence over the score. The score is not a final decision maker, but an analytical auxiliary tool supporting the beekeeper’s decision-making process.
Frequently Asked Questions
Is the nectar flow score a 100% accurate prediction?
No. The score is a statistical/experimental prediction based on current weather data and GDD-adjusted plant phenology. The actual condition of the hive, local microclimate, and direct observation by the beekeeper always take precedence.
What is GDD (Growing Degree Days)?
GDD is a method used for decades in agriculture and horticulture to measure the rate of plant development by the accumulation of daily mean temperature above a certain threshold (base temperature). This accumulation helps predict plant flowering time more reliably than the calendar date.
Why is the score calculated differently according to the region?
The same temperature and humidity values can mean a different nectar flow in the Pannonian plain, in the Alpine foothills, or along the Black Sea coast. Therefore, separate weighting coefficients are used for each climate zone.
Can hive moving or harvesting decisions be made based on this score?
The score is a helper tool that provides input to the decision-making process, not a standalone decision mechanism. Hive control, colony strength, and local observation should always be the primary basis.
About Polinasyon Lab: Polinasyon Lab is a next-generation field management panel that works offline for beekeepers, bringing together nectar flow score, hive tracking, wing morphometry, and breeding records on a single screen. The technical methods in this article are derived from the application’s own algorithm and are periodically reviewed in parallel with ecosystem updates.
· Explore the app → lab.polinasyon.orgSource: Polinasyon — polinasyon.org · Project: Polinasyon Lab · Contact: info@polinasyon.org
Suggested Citation:
Altıntaş, F. (2026). How to Calculate the Nectar Flow Score Using GDD? Polinasyon Lab Academy. www.polinasyon.org/2026/09/how-to-calculate-nectar-flow-score-using-gdd.html