Beekeeping success has always depended on precision timing. Knowing exactly when forage plants start to yield nectar, when colonies need supplemental support, and when environmental conditions turn against them separates a highly profitable honey season from a poor one. In an era of climate crisis and unpredictable weather patterns, traditional calendar-based decisions are no longer reliable. That is precisely the data gap Polinasyon Lab is engineered to address.
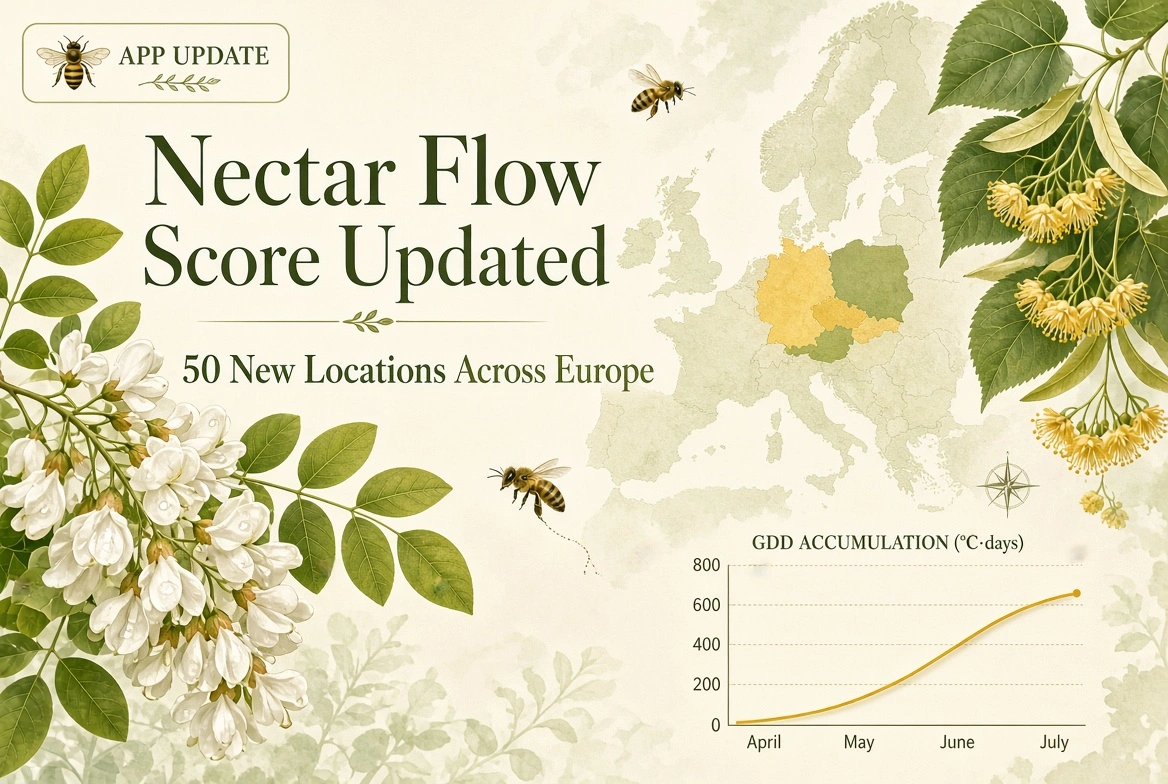
The latest smart infrastructure update adds 50 new hyper-local nodes across Central Europe, with the strongest focus on expanding precision agriculture in Germany. Total active coverage has grown from 273 to 323 microclimate tracking points. Local and migratory beekeepers in the region can now run predictive nectar flow scores and Growing Degree Days (GDD) calculations much closer to their own apiary locations.
You can explore your regional data free of charge on our interactive dashboard:
👉 lab.polinasyon.org/nektar
What was added: 50 New Precision Monitoring Hubs
The new tracking nodes are concentrated in agricultural and forest regions where high-density independent phenology data is available. The geographical distribution by country includes:
Germany (30 Hubs)
Kassel, Erfurt, Dresden, Leipzig, Nuremberg, Würzburg, Münster, Hannover, Göttingen, Magdeburg, Halle, Regensburg, Stuttgart, Karlsruhe, Freiburg, Mainz, Koblenz, Cologne, Dortmund, Osnabrück, Chemnitz, Bayreuth, Fulda, Gießen, Trier, Kiel, Bremen, Rostock, Braunschweig, Augsburg
Poland (5 Regions)
Poznań, Gdańsk, Lublin, Katowice, Szczecin
Czechia (3 Stations)
Ostrava, Plzeň, Olomouc
Austria (4 Locations)
Linz, Salzburg, Innsbruck, Klagenfurt
Switzerland (2 Stations)
Bern, Basel
Netherlands (2 Points)
Utrecht, Groningen
Other Central European Stations (4 Points)
Liège (Belgium), Aarhus (Denmark), Strasbourg (France), Košice (Slovakia)
Current Coverage & Regional Network Distribution
| Precision Monitoring Region | Active Tracking Locations |
|---|---|
| Türkiye | 153 |
| Europe (Previous + New) | 110 |
| Azerbaijan | 40 |
| Russia | 14 |
| Kazakhstan | 3 |
| Belarus | 3 |
| Total Global Ecosystem | 323 |
This framework brings significantly denser agtech coverage to Germany’s most vital foraging valleys. While earlier versions of the platform supported only a limited set of major metropolitan areas, the tracking network now directly reaches rural apiaries and migratory routes critical for commercial honey production.
Data Science Behind the Expansion: Why These Regions First?
The selection of these 50 new nodes relies on strict agro-meteorological and scientific criteria. The vast majority of observations in the pan-European phenology database (PEP725) originate from Germany and its immediate neighbors. When validating regional flowering dates for major honey-producing flora—such as Black Locust (Robinia pseudoacacia) and Linden (Tilia)—the most consistent and reliable data signals came from this specific Central European corridor.
By prioritizing the geographic areas with the richest independent dataset records, the automatically generated GDD ranges rest on a firm empirical base rather than generic climate normals. This optimization minimizes error rates for localized plant development models.
Precision Beekeeping Features: What This Means in Practice
Implementing digital data analytics directly at the apiary helps answer critical field questions in real time:
- Hyper-Local GDD Tracking — Plant vegetative growth and blooming periods are driven by accumulated heat units, not calendar dates. The algorithm follows the actual daily thermal progress of each microclimate.
- Region-Specific Phenology Mapping — Foraging timelines can differ significantly even inside the same state borders. The new tracking points make these subtle microclimatic variations visible to apiary managers.
- Daily Nectar Flow Score — Blends floral nectar secretion limits with real-time honeybee flight thresholds into a single, highly actionable index.
- Limiting Factor Analysis — Highlights exactly what environmental stressor is currently restricting honey collection (e.g., high winds, low soil moisture, elevated Vapor Pressure Deficit (VPD), or sudden temperature drops).
The entire application runs directly inside your web browser. No account registration is required, and your private apiary location data stays securely on your device. The client-side architecture ensures smooth dashboard performance even with weak cellular connectivity in remote bee yards.
Frequently Asked Questions (FAQ)
How does Polinasyon Lab calculate the daily Nectar Flow Score?
The Nectar Flow Score integrates real-time agro-meteorological variables—such as Growing Degree Days (GDD), relative humidity, soil moisture, wind speed, and Vapor Pressure Deficit (VPD)—with historical flowering thresholds (BBCH scale data from PEP725). This generates a daily 0–100 index representing real-time nectar secretion and honeybee foraging potential for specific microclimates.
Why are Growing Degree Days (GDD) more reliable than calendar dates for beekeeping?
Plant development and bloom onset depend entirely on accumulated thermal heat units rather than calendar months. By tracking daily temperature accumulation using a base baseline (GDD), beekeepers can accurately predict exact flowering phases (like Robinia pseudoacacia or Tilia blooming) regardless of early spring freezes or unusual heatwaves.
Is Polinasyon Lab free to use for independent beekeepers?
Yes, Polinasyon Lab is a 100% free, open-source, and non-commercial precision agriculture tool. Beekeepers can access microclimate predictions, GDD metrics, and nectar flow indicators across all 323 active hubs without paid subscriptions or user accounts.
Does Polinasyon Lab store or track my private apiary locations?
No. Polinasyon Lab is engineered as an offline-capable Progressive Web App (PWA) with full client-side processing. Your spatial queries, custom apiary coordinates, and dashboard parameters remain strictly local to your device browser, ensuring complete privacy and data sovereignty.
How often is environmental and weather data updated on the platform?
Agro-meteorological datasets and atmospheric reanalysis models (via Open-Meteo ERA5 integration) are synchronized daily to provide continuous real-time Nectar Flow Scores and predictive thermal forecasts across all 323 tracking locations.